New Method for Interpreting a Predictive Analytic Model in Child Welfare Shows Promise


Child welfare administrators are increasingly interested in using predictive analytics to inform prevention strategies. However, difficulty in interpretation of robust predictive analytic models, such as machine learning (ML) models, has stymied translation of research into practice and policy in child welfare. As a proof of concept, we sought to bridge this gap in child welfare by testing a novel interpretation methodology in ML, Shapley Additive Explanation or SHAP. Demonstrating that SHAP can be used in child welfare research might facilitate end users of ML, such as child welfare administrators and caseworkers, in making relevant practice and policy changes.
What We Did
First, we developed a random forest ML model to predict the risk of youth running away from care within 90 days of entering a child welfare system. We examined 8,255 legal custody spells for youth who were 12 to 17 years old and who entered the legal custody of the Illinois Department of Children and Family Services (DCFS) between January 1, 2010 and June 30, 2018. We used DCFS administrative data to operationalize 29 predictors of demographic, child welfare, and clinical characteristics. Second, we applied SHAP to the random forest ML model to identify and quantify the influence of important predictors and combination of predictors on the predicted risk of runaway.
What We Found
The random forest ML model achieved excellent overall prediction accuracy with an area under the sensitivity vs. 1-specificity curve of 0.88, when “perfect” prediction would yield an area under the curve of 1.00.
The model also achieved excellent model precision—among youth’s spells predicted to run away within 90 days of entry to care, the percentage of youth’s spells with an actual runaway event, without sacrificing model recall—among all youth’s spells with an actual runaway event within 90 days of entry to care, the percentage of youth’s spells with an actual runaway event. Among youth with a ≥ 40% predicted risk of running away within 90 days of entry to care, 91.92% of them actually ran away. This accounted for 67.82% of all youth in the sample who ran away:

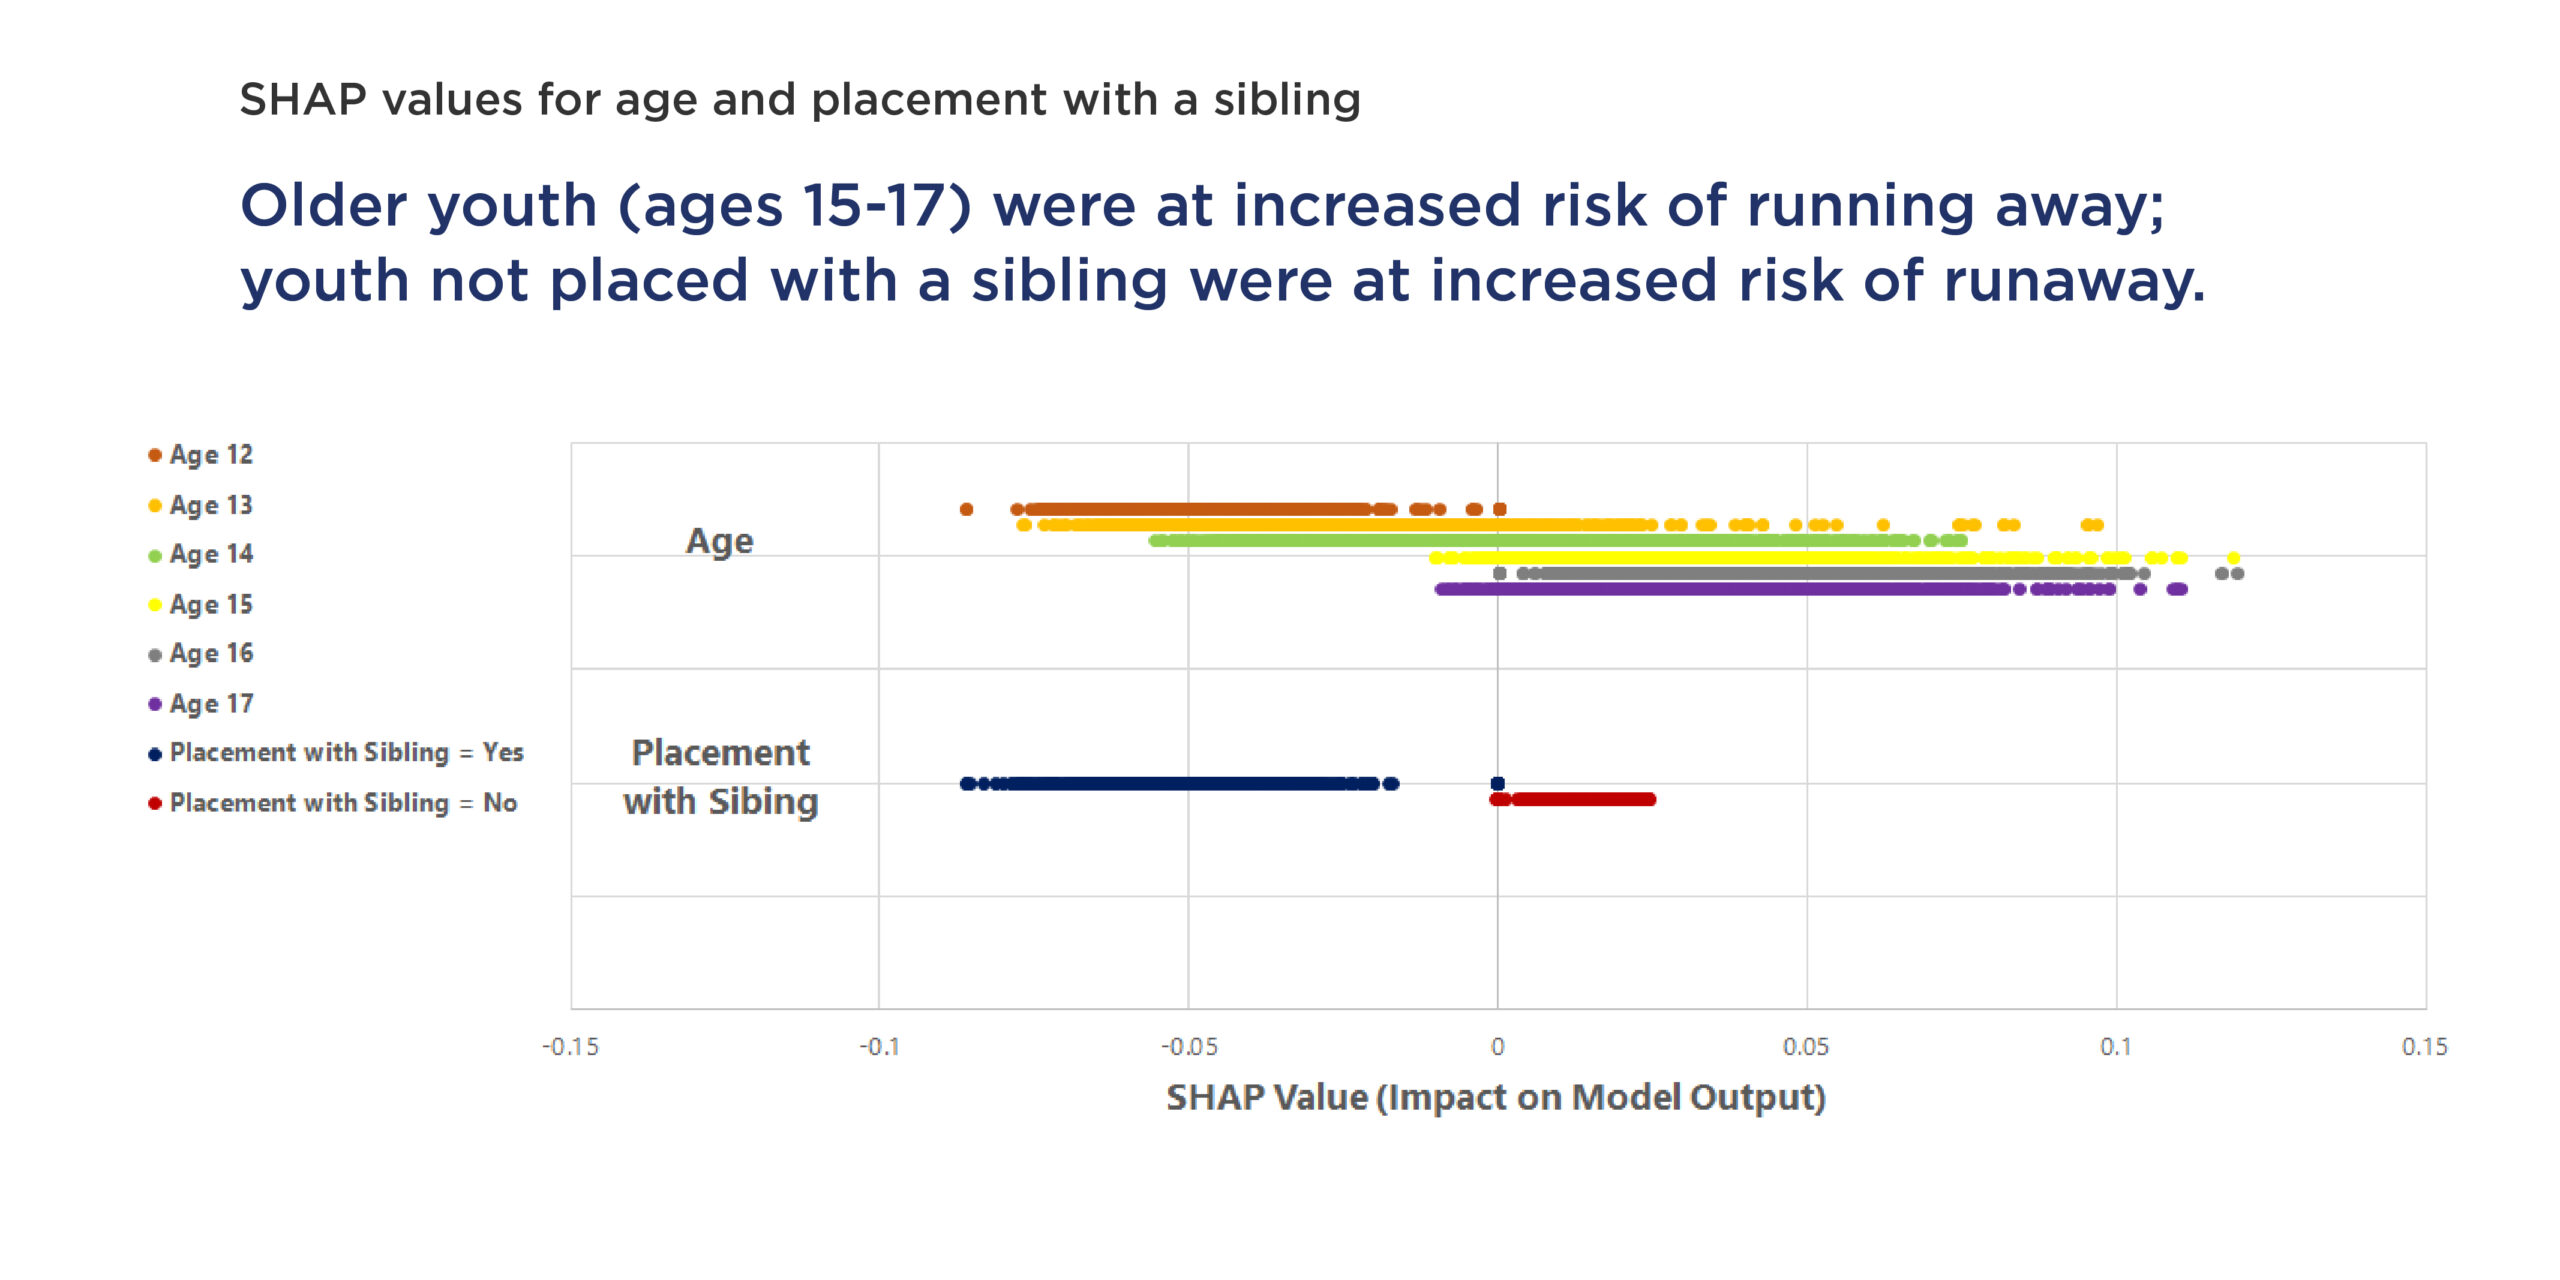
Positive SHAP values indicated an increased predicted risk of runaway relative to an average youth. Conversely, negative SHAP values indicated a decreased predicted risk of runaway relative to an average youth. Age and placement with a sibling were two predictors with the highest average SHAP values. Older youth showed an increased predicted risk of runaway while youth coplaced with a sibling showed a decreased predicted risk of runaway:
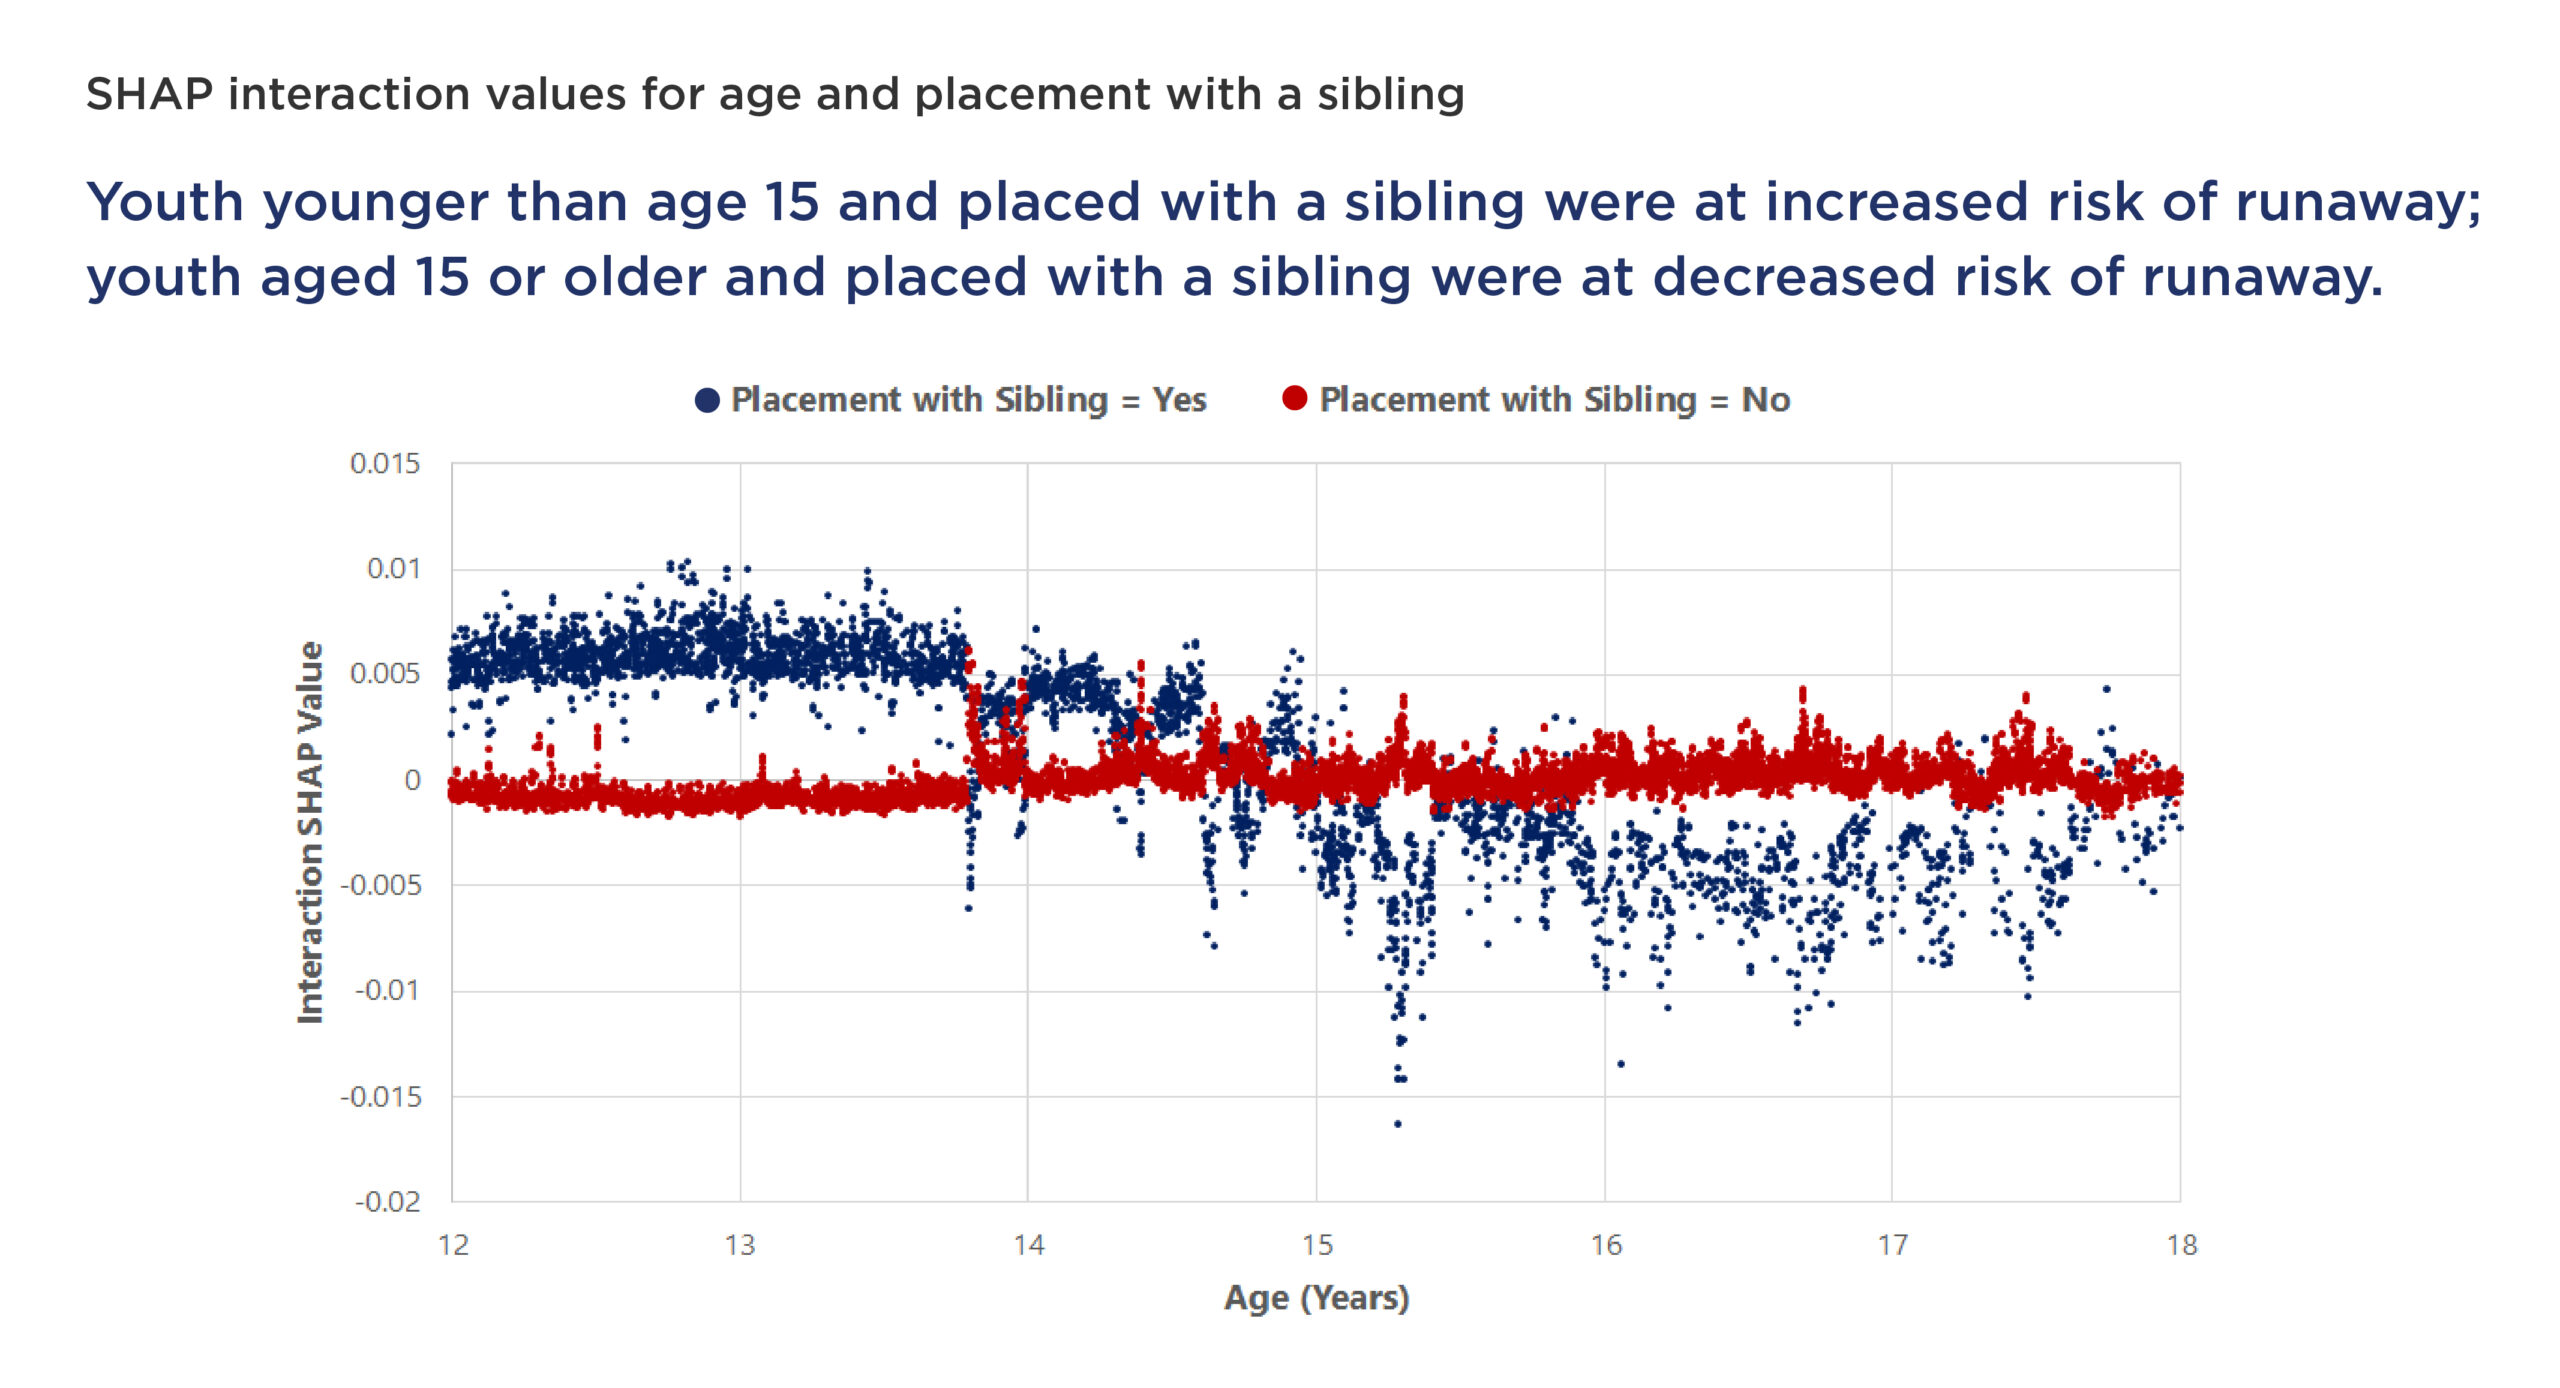
 SHAP interaction values show the combined impact of individual predictors. Positive SHAP interaction values indicated an increased predicted risk of runaway relative to an average youth. Conversely, negative SHAP interaction values indicated a decreased predicted risk of runaway relative to an average youth. Youth younger than age 15 and coplaced with a sibling had positive SHAP interaction values, which indicated an increased predicted risk of runaway. In contrast, youth older than age 15 and coplaced with a sibling had negative SHAP interaction values, which indicated a decreased predicted risk of runaway:
What It Means
When a methodologically sound ML predictive analytic model is appropriate to answer a research, policy, or practice question, child welfare administrators who value data-driven decisions and interpretability might consider using the SHAP interpretation methodology to:
- Demystify the “black box” nature of ML predictive analytic models.
- Identify relationships between predictors and outcomes not previously known, especially for complex outcomes for which there are large-scale, administrative data to leverage ML.
- Identify system-level implications, for example, tailored service pathways, by examining aggregated SHAP values of individual predictors to focus on predictors with the greatest average impact on increasing or decreasing risk.
- Identify case-level implications, for example, a specific youth’s needs, by examining individual youth’s SHAP values that illuminate the youth’s protective and risk factors.
- Explore predictor interactions of interest, for example, “Early childhood services for coplaced children are paramount to my role as an administrator,” and blind spots, for example, “I have never thought about looking at the interaction of ethnicity and age,” by examining relevant SHAP interaction values that may provide similar policy and practice guidance at the system and case level.
 Thank you for your interest in Chapin Hall’s research. Please share some information to access this file.